
Flood modeling at any scale
17 square miles of one city, 79.5 square miles of one watershed shared by six jurisdictions, 186.5 square miles of a city spanning several watersheds, and 391 square miles of basin-wide screening. The same rain-on-mesh approach, adapted to different questions, levels of detail, and available data.
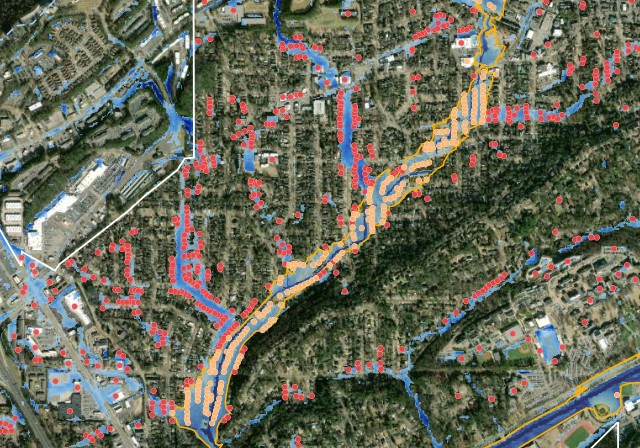
Homewood
City scale
About 17 square miles, with detailed breaklines, culverts, bridges, and comparison against observed and regulatory data.
Have a code? Enter it above. Otherwise request access.
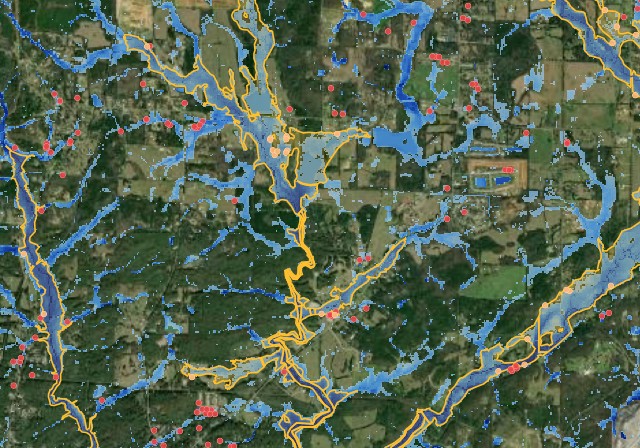
Shoal Creek
Watershed scale
One HUC-12, 79.5 square miles, draining across six jurisdictions. Montevallo and Wilton sit entirely inside it; Alabaster, Calera and Pea Ridge each keep most of their land somewhere else.
Have a code? Enter it above. Otherwise request access.
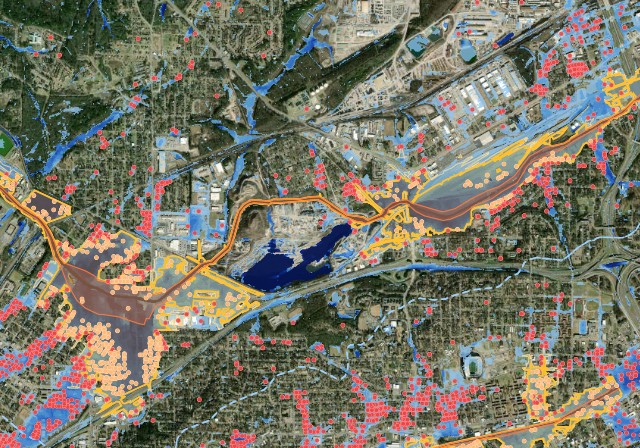
Birmingham
Three-watershed scale
Three HUC-12 watersheds covering 186.5 square miles, calibrated against ten USGS gages and checked against the December 2015 flood.
Have a code? Enter it above. Otherwise request access.
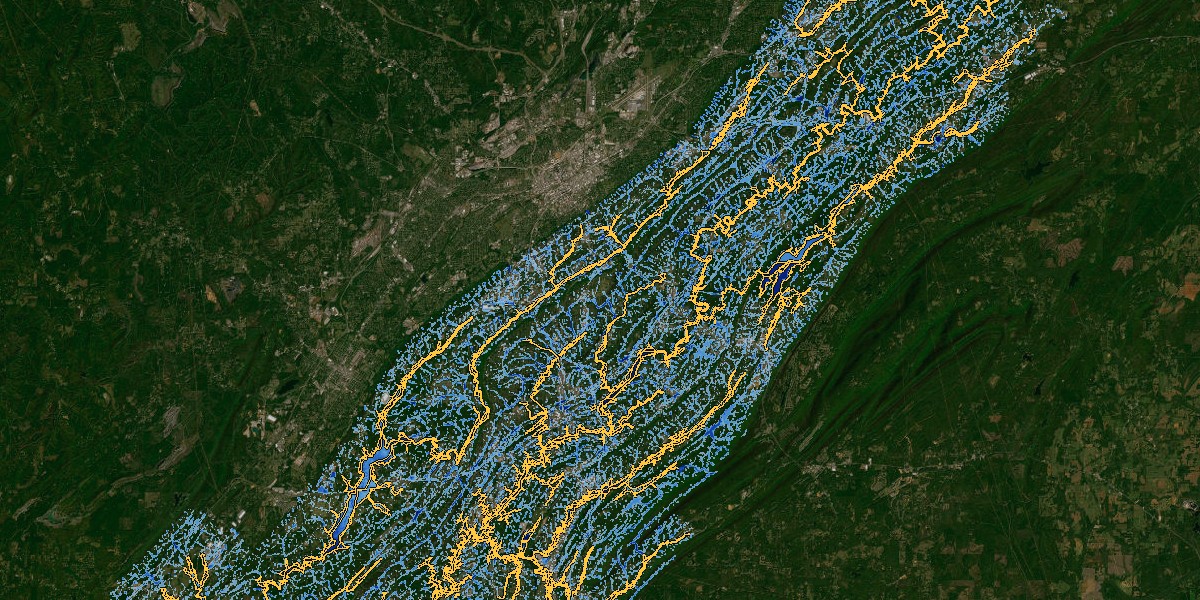
Cahaba
Basin scale
A 391-square-mile screening model spanning multiple HUC-12 watersheds and 26 communities.
Open to anyone. Building-level results are by request.
How they are built
The scale and level of detail differ. The underlying method does not.
- Terrain. Built on 1-meter LiDAR, hydro-enforced with stream, ridge and road breaklines so water routes the way it really does.
- Method. 2-D rain-on-mesh in HEC-RAS: rain falls on every cell of the model, then flows downhill across the surface.
- Inputs. Design rainfall from NOAA Atlas 14, infiltration from SSURGO soils (Green-Ampt), and surface roughness from NLCD land cover (Manning's n).
- What varies between them. Breakline density, how many hydraulic structures are built, and whether there are gage records to calibrate against. Everything else is the same method pointed at a different area.
What a city does with one
A model becomes valuable when a city keeps using it.
Evaluate new development
Run a proposed subdivision or commercial site and see its downstream effect before it is approved.
Test a fix before you design it
Model a detention basin, a culvert upsize or a channel modification and see what it actually relieves.
Answer a complaint with numbers
Pull up any street and show the real depth and how often it floods.
Prioritize the capital plan
Rank drainage projects by the flooding and damage they actually relieve.
Keep it current
Update it as the city grows or after a major storm, so it reflects today rather than the year it was built.
Make the funding case
Name the buildings a project protects and what the damage costs. That is the arithmetic a FEMA or CDBG application has to show.
Want to see your city modeled?
Most communities start at screening and only pay for detail where the screening says it matters.